Workplace Storage Analytics UK: Occupancy, Utilisation and Estate Optimisation
May 13, 2026
Workplace storage analytics helps organisations understand how lockers, cabinets, smart storage systems and shared-use storage areas are actually used across an estate.
Instead of planning storage by guesswork, facilities teams can use occupancy data, utilisation dashboards, heatmaps and demand forecasting to make better operational decisions.
This is especially valuable in hybrid workplaces, large offices, NHS estates, schools, universities, industrial sites and multi-site organisations where storage demand changes over time.
What Is Workplace Storage Analytics?
Workplace storage analytics is the process of collecting, reviewing and using storage data to improve how workplace storage assets are planned, managed and maintained.
It can include lockers, smart lockers, charging lockers, PPE lockers, staff storage, visitor storage, parcel lockers, key cabinets and shared workplace storage systems.
The aim is simple: understand what is used, what is underused, where demand is growing and where storage infrastructure should change.
Why Storage Analytics Matters
Many workplaces carry more storage than they need in some areas, while other areas suffer from shortages, congestion or poor availability.
Storage analytics helps facilities teams identify:
- unused lockers
- overcrowded storage zones
- high-demand departments
- low-utilisation areas
- abandoned storage spaces
- hybrid workplace demand patterns
- future expansion requirements
- opportunities to rationalise the estate
Occupancy Heatmaps
Occupancy heatmaps show where storage demand is highest across a workplace or estate.
They can highlight:
- busy locker rooms
- underused storage banks
- department-level demand
- peak usage zones
- shared-use storage pressure
- areas with poor availability
Heatmaps are useful because they turn complex usage data into a clear visual management tool. Facilities teams can quickly see where capacity is working and where changes are needed.
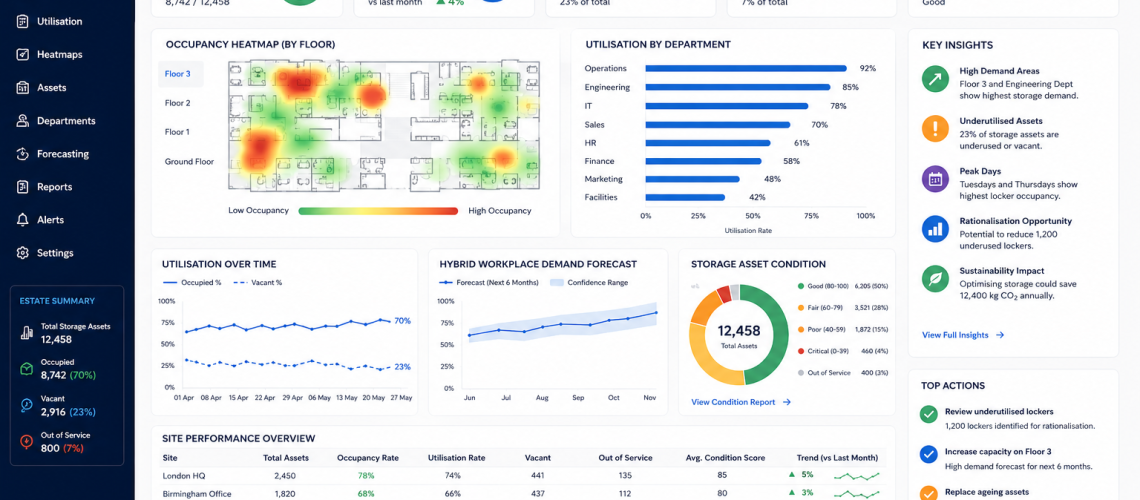
Utilisation Dashboards
Utilisation dashboards provide live or periodic reporting on storage performance.
A workplace storage dashboard may include:
- total storage assets
- occupied lockers
- vacant lockers
- shared-use turnover
- fault levels
- maintenance status
- department demand
- site-by-site comparisons
- replacement priorities
This gives facilities teams a central view of storage performance across the workplace.
Estate Rationalisation
Estate rationalisation means reviewing storage assets and deciding whether they should be retained, relocated, reduced, replaced or expanded.
Analytics supports rationalisation by showing:
- which storage areas are underused
- which locker banks are in poor condition
- where replacement gives the best value
- where unused storage occupies valuable floor space
- where hybrid working has changed demand
- where shared-use lockers could replace assigned lockers
This helps organisations reduce waste while improving availability where storage is genuinely needed.
Hybrid Workplace Demand Forecasting
Hybrid working has changed workplace storage demand. Fewer staff may be on site every day, but storage demand can still peak sharply on certain days or in certain departments.
Storage analytics can help forecast:
- peak office attendance days
- hot locker demand
- temporary storage requirements
- shared-use locker turnover
- department-based storage pressure
- future capacity needs
This supports better planning for flexible workplaces, desk-sharing environments and agile working models.
Operational Efficiency Metrics
Storage analytics works best when it uses clear operational metrics.
| Metric | What It Shows |
|---|---|
| Occupancy rate | How much storage is currently in use |
| Vacancy rate | How much storage capacity is unused |
| Turnover rate | How often shared-use storage changes user |
| Peak demand | When storage demand is highest |
| Fault rate | How often storage assets need repair |
| Asset condition score | How suitable the storage asset remains |
| Replacement priority | Which assets should be replaced first |
| Cost per active locker | How efficiently storage investment is being used |
Workplace Storage Analytics Data Fields
A useful analytics system depends on structured storage data.
| Data Field | Purpose |
|---|---|
| Asset ID | Links each locker or storage unit to a unique record |
| Location | Shows where the asset is positioned |
| Storage type | Identifies locker, cabinet, charging locker or specialist storage |
| User group | Connects storage demand to staff, visitors or departments |
| Occupancy status | Shows whether the asset is occupied, vacant or inactive |
| Usage frequency | Supports utilisation and wear analysis |
| Condition score | Helps plan maintenance and replacement |
| Fault history | Shows reliability and repair trends |
| Access type | Tracks key, RFID, PIN, app or smart access systems |
| Replacement status | Supports long-term estate planning |
Smart Lockers and Analytics
Smart lockers can provide stronger analytics because they can record access events, availability, occupancy duration, fault alerts and usage trends.
This helps organisations understand how storage is being used in real time or through scheduled reports.
Smart locker analytics may support:
- live availability
- usage history
- occupancy heatmaps
- access reporting
- remote administration
- fault alerts
- predictive maintenance
- demand forecasting
Storage Analytics for Multi-Site Estates
Multi-site organisations need consistent visibility across different buildings, branches and operational sites.
Analytics can compare:
- storage demand by site
- locker condition by location
- fault rates by building
- maintenance costs by department
- occupancy across different workplace types
- replacement priorities across the estate
This allows estates teams to make better decisions using shared evidence rather than local assumptions.
How Storage Analytics Supports CAFM Integration
Workplace storage analytics becomes stronger when connected to CAFM systems and facilities-management platforms.
CAFM integration allows storage data to connect with:
- asset registers
- planned maintenance
- helpdesk tickets
- inspection schedules
- replacement planning
- compliance reporting
- multi-site dashboards
This helps storage become part of the wider workplace infrastructure model rather than a separate operational issue.
Analytics Workflow for Workplace Storage
| Stage | Action | Outcome |
|---|---|---|
| 1. Asset mapping | Record storage assets by location and type | Creates estate visibility |
| 2. Occupancy review | Track used, vacant and inactive storage | Shows demand patterns |
| 3. Utilisation analysis | Compare demand across sites and departments | Identifies underuse and pressure points |
| 4. Condition scoring | Assess damage, wear and maintenance history | Supports lifecycle planning |
| 5. Forecasting | Use trends to predict future demand | Improves investment planning |
| 6. Rationalisation | Relocate, replace, reduce or expand storage | Improves efficiency and cost control |
Internal Links for Workplace Storage Analytics
- Smart Locker Analytics UK
- Locker Occupancy Management Systems UK
- Locker CAFM Integration UK
- Locker Asset Register UK
- Locker Estate Audit UK
- Locker Lifecycle Management UK
- Locker Management Systems UK
- Workplace Locker Operations UK
Conclusion
Workplace storage analytics gives organisations better control over lockers, storage assets and operational infrastructure.
By using occupancy heatmaps, utilisation dashboards, estate rationalisation, hybrid workplace forecasting and clear efficiency metrics, facilities teams can make stronger decisions about storage planning and investment.
As workplaces become more flexible and data-led, storage analytics will become an important part of wider facilities management, workplace planning and estate optimisation.
Discover more from Blog Total Locker Service
Subscribe to get the latest posts sent to your email.