Smart Locker Analytics UK: Trends, Heatmaps, Comparisons & Data Interpretation
May 13, 2026
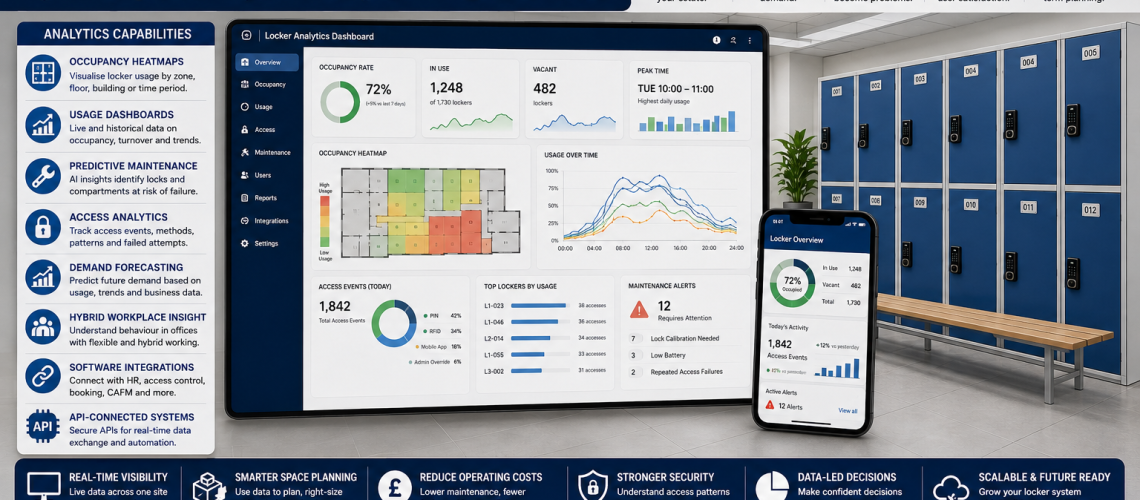
Smart locker analytics turns reliable locker data into trends, comparisons, heatmaps and management evidence. Its role is not to define occupancy, access, maintenance or replacement rules, but to combine those underlying datasets so organisations can see patterns that are difficult to identify from individual records.
Useful analytics can compare locker demand by site, zone, department and time period; identify changing utilisation patterns; highlight repeated exceptions; show whether one location behaves differently from another; and provide evidence for further investigation.
This guide focuses on locker trends, heatmaps, baselines, comparative reporting, exception analysis, data quality, normalisation and interpretation. For the underlying occupancy definitions, use Locker Occupancy Management Systems UK. For dashboards, exports and APIs, use Smart Locker Management Software UK.
Analytics does not create good data. It helps organisations interpret good data that already has clear definitions and reliable sources.
Quick Answer: What Is Smart Locker Analytics?
Smart locker analytics is the structured comparison and interpretation of locker data over time. It may combine occupancy, allocation, access, asset, fault, maintenance and location information to identify patterns, differences and exceptions.
| Layer | Purpose |
|---|---|
| Source data | Records individual facts such as occupancy, access, fault or asset status |
| Metric | Defines what is being measured and the denominator used |
| Analytics | Compares defined metrics across time, place, asset groups or operating contexts |
| Interpretation | Explains what the pattern may indicate and what uncertainty remains |
| Specialist decision | The relevant owner decides whether to investigate, reallocate, repair, refurbish, replace, redesign or fund further work |
What This Page Owns, and What It Hands Off
- Trends, comparisons, heatmaps, baselines and analytical interpretation: this page
- Metric definitions, denominators and KPI formulas: Locker KPI & Performance Metrics UK
- Occupied, vacant, usable, unavailable and utilisation definitions: Locker Occupancy Management Systems UK
- Access events and audit-log structure: Locker Access Audit Systems UK
- Fault prediction and maintenance prioritisation: Locker Predictive Maintenance UK
- Dashboards, exports, APIs and reporting interfaces: Smart Locker Management Software UK
- System integration architecture: Locker Infrastructure Systems UK
- Personal data, retention and privacy: Locker Access Compliance UK
- Stable physical asset fields and identifiers: Locker Asset Register UK
- Combined estate status and portfolio coordination: Locker Estate Management UK
- Replacement timing and intervention decisions: Locker Lifecycle Management UK
- Replacement programme scope and phasing: Locker Replacement Planning UK
- Assigned, shared, hot and temporary allocation models: Locker Allocation Systems UK
- User onboarding, reassignment and offboarding: Locker Management Systems UK
- Key, PIN, RFID and digital access technology: Locker Access Control Systems UK
- Capital exposure and budget forecasting: Locker Capital Planning UK
Analytics Does Not Authorise the Action
Analytics can show that a pattern exists, how large it is, how long it has persisted and where it differs from the baseline. It should not silently promote that pattern into an operational decision.
| Analytical evidence | Analytics can say | Analytics should not decide |
|---|---|---|
| Persistent high occupancy | Measured demand is consistently higher in this zone than comparable zones | How many new lockers to buy |
| Persistent low use | Measured use remains below the declared baseline | Remove the locker bank |
| Repeated lock faults | Faults are concentrated in this lock family or location | Replace the lockers or select a new access system |
| Repeated access failures | Failed events have increased relative to the previous period | Attribute blame to users or change credential policy |
| Repair recurrence | The same assets receive repeated maintenance events | Repair, refurbish or replace |
| Site-to-site difference | One site differs materially after normalisation | Assume the site is poorly managed |
| Rising projected demand | Historic patterns plus declared assumptions indicate possible future pressure | Approve capital expenditure |
The analytical output should preserve the evidence, assumptions and uncertainty, then route the question to the process that owns the decision.
Reliable Data Comes Before Analytics
A graph can be visually convincing while still being based on inconsistent data. Before comparing locker performance, every source should use stable locker references, locations and definitions.
- Stable site, building and locker identifiers
- Known reporting periods
- Consistent definitions of occupied, vacant and unavailable
- Consistent fault categories
- Known source system
- Known data gaps
- Reliable timestamps where time comparisons are used
- Documented changes in allocation or operating policy
A dashboard that mixes assignment records from one site with verified occupancy from another can create a false comparison even when both datasets are technically accurate.
Analytics, Metrics, Reporting and Software Are Different Layers
| Layer | Owns |
|---|---|
| Metrics / KPI | Definition, numerator, denominator, reporting unit and calculation rule |
| Analytics | Comparison, segmentation, trend, baseline, exception and interpretation |
| Reporting | How findings are assembled for operational or executive review |
| Software | Dashboards, filters, exports, alerts, interfaces and APIs |
| Specialist process | The operational, technical, lifecycle or financial decision that follows |
For metric definitions and formulas, use Locker KPI & Performance Metrics UK. For dashboard and platform capability, use Smart Locker Management Software UK.
Asset and Location Data as the Analytical Baseline
Analytics needs to know what physical estate the events relate to.
| Baseline field | Why it matters |
|---|---|
| Locker / compartment ID | Links events to a specific physical unit |
| Site | Supports site-level comparison |
| Building / floor / area | Supports location analysis |
| Locker bank | Allows local patterns to be identified |
| Lock type | Allows technology comparisons |
| Availability status | Prevents unavailable lockers being counted as usable capacity |
| Installation / refurbishment history | Adds context to age and condition trends |
For stable physical asset fields and identifiers, use Locker Asset Register UK. For the combined estate view that brings asset, condition, occupancy, maintenance and lifecycle status together, use Locker Estate Management UK.
Occupancy Heatmaps as an Analytical Output
A heatmap is useful when it visualises a clearly defined measure across locations or time periods.
| Heatmap | What it can show | Important caution |
|---|---|---|
| Occupancy by zone | Areas with greater measured demand | Use consistent occupancy definitions |
| Vacancy by zone | Areas with lower use | Check whether lockers are physically suitable and available |
| Demand by time | Periods with higher use | Compare equivalent days and operating periods |
| Faults by location | Areas with repeated faults | Check reporting behaviour and environment before inferring cause |
| Access exceptions | Locations with more failed or exceptional events | Do not assume user behaviour is the cause |
Assignment heatmaps and occupancy heatmaps are not interchangeable. An allocated locker may be unused, while one shared locker may serve several users during the reporting period.
Trends Over Time
Time-series analysis can show whether locker behaviour is stable, seasonal or changing.
- Daily demand
- Weekly demand
- Term-time vs holiday periods
- Shift-based patterns
- Seasonal workplace attendance
- Changes after an allocation-policy change
- Changes after a refurbishment or lock upgrade
- Changes after relocation of a locker bank
Use comparable periods. A September school term should not be directly compared with an August holiday period without acknowledging the different operating context.
Baselines Before Change
A baseline gives the organisation something to compare against after a change.
- Occupancy before changing allocation rules
- Fault rate before replacing a lock type
- Demand before relocating a locker bank
- Access failures before introducing a new credential
- Maintenance callouts before refurbishment
Without a baseline, it can be difficult to tell whether a change actually improved the estate or merely coincided with a different operating period.
Site-to-Site Locker Comparisons
Multi-site analytics can highlight meaningful differences, but only after the data has been normalised.
- Use the same occupancy definition.
- Use the same fault categories.
- Compare equivalent reporting periods.
- Separate different user populations.
- Account for different locker quantities.
- Account for unavailable lockers.
- Account for different working patterns.
- Record major differences in locker size, age or environment.
A site with more faults may simply have more lockers. A useful comparison may therefore use faults per 100 lockers or another declared denominator rather than raw fault counts alone.
Department and Zone Comparisons
Within one site, analytics can compare locker behaviour by department, floor, changing room, locker bank or other defined zone.
- Which zones reach peak capacity first?
- Which zones have persistent spare capacity?
- Are faults concentrated in one environment?
- Do particular locker sizes show different use?
- Did demand move after a department relocation?
Location analysis can reveal that an apparent capacity problem is actually a distribution problem. Spare lockers in the wrong building do not automatically solve demand in a high-pressure changing area.
Peak-Demand Analysis
Average use can hide periods when locker demand is much higher.
- Peak weekday
- Peak shift change
- Peak lesson-change period
- Peak seasonal period
- Peak event or visitor period
- Peak hybrid-workplace attendance
Analytics should identify the peak and its duration rather than assuming the average represents operational pressure. The underlying capacity decision belongs in How Many Lockers Do You Need?.
Utilisation Trends
Utilisation analytics compares defined use over a period. It can help identify whether demand is increasing, falling or moving between zones.
- Increasing use in one building
- Declining use after a department move
- Persistent underuse of one locker bank
- Higher turnover in shared-use lockers
- Changing demand after hybrid-working changes
The metric itself should come from Occupancy Management. Analytics owns the comparison and interpretation over time.
Access-Event Analysis
Access records can contribute to analytics where they have been defined consistently.
- Failed-access trends
- Override frequency
- Reset frequency
- Temporary-access event volumes
- Credential-revocation patterns
A failed access event does not identify its cause on its own. It may reflect a user error, expired credential, battery problem, damaged mechanism or software issue. The detailed event model belongs in Locker Access Audit Systems UK.
Fault and Maintenance Trend Analysis
Analytics can compare faults and repairs without trying to own the maintenance process itself.
- Repeat faults by locker
- Faults by lock type
- Faults by location
- Repair recurrence
- Battery alerts by product type
- Faults before and after refurbishment
- Maintenance volume by site
These patterns can identify where inspection is worthwhile. They do not prove that a component will fail next or identify cause without further evidence. Predictive maintenance belongs in Locker Predictive Maintenance UK.
Exception Analysis
Analytics becomes more useful when it highlights exceptions rather than producing large volumes of routine data.
- Locker bank significantly busier than comparable areas
- Fault rate above the normal site range
- Unexpected increase in failed access
- Allocation rate rising while measured use falls
- Repeated override use in one location
- Unusually high maintenance recurrence
- Large difference between recorded capacity and usable capacity
An exception should trigger investigation, not an automatic conclusion.
Correlation Is Not Cause
Locker analytics often reveals correlations. Those relationships may be useful, but they do not automatically explain why something happened.
- High use and high fault rates may be related, but product age or environment may also matter.
- Low occupancy may indicate surplus capacity, poor location, unsuitable locker size or inaccurate data.
- Failed access may reflect credential problems, hardware problems or user behaviour.
- A drop in use after relocation may reflect changed staff numbers rather than the new locker position alone.
Use analytics to narrow the investigation. Then verify the physical and operational context.
Show Analytical Coverage and Confidence
A strong analytical result should show not only the pattern but also how much evidence supports it.
- Reporting period covered.
- Number of lockers or compartments represented.
- Sites or zones included.
- Missing periods or missing assets.
- Whether the source is measured, manually recorded or inferred.
- Whether definitions changed during the comparison period.
- Whether an operating-policy change affects comparability.
- Whether the result is descriptive, exploratory or based on a declared forecast assumption.
Where coverage is incomplete, state the limitation rather than presenting the result with the same confidence as a complete dataset.
Data Quality and Completeness
Every analytical output should make its data limitations visible.
| Data issue | Possible effect |
|---|---|
| Missing locker IDs | Events cannot be reliably linked to assets |
| Missing periods | Trend may appear lower than reality |
| Different occupancy definitions | Sites become non-comparable |
| Unrecorded manual access | Digital event data is incomplete |
| Poor fault reporting | One site may appear artificially reliable |
| Clock or timestamp errors | Event sequence can be distorted |
| Old user records | Assignment and use comparisons become misleading |
Normalising Locker Data
Normalisation makes comparisons fairer when sites or locker groups are different sizes.
- Faults per 100 usable lockers
- Repairs per locker bank
- Access failures per 1,000 access events
- Peak occupancy as a percentage of usable capacity
- Turnover per shared-use locker
The denominator should always be declared. Changing the denominator can materially change the interpretation.
Comparative Dashboards
A useful analytical dashboard can bring several comparable measures together without trying to become the source system for each one.
- Site vs site
- Zone vs zone
- Current period vs previous period
- Before vs after intervention
- Assigned vs measured use
- Fault rate vs usage level
- Maintenance recurrence vs asset age
The software platform owns how those views are displayed, filtered and exported. For platform capability, use Smart Locker Management Software UK.
Analytics and Forecasting
Historic locker data can support planning assumptions about future demand, but forecasts should remain explicit about what is known and what is assumed.
- Use historic peak demand, not only averages.
- Record expected changes in staff or pupil numbers.
- Separate current evidence from future assumptions.
- Allow for unavailable lockers.
- Document changes in working patterns.
- Test scenarios rather than presenting one forecast as certainty.
Analytics can support the evidence base and test declared scenarios. Capacity belongs in Planning and Occupancy Management, intervention belongs in Lifecycle Management, and the financial consequence belongs in Locker Capital Planning UK.
Analytics for Hybrid Workplaces
Hybrid workplaces can benefit from comparison by weekday, department and location because attendance can vary substantially.
- Peak attendance day vs average day
- Locker use by department
- Assigned lockers with little measured use
- Shared-locker turnover
- Demand by building or floor
- Changes after allocation-policy updates
Analytics should inform the allocation decision rather than make it automatically. For assigned, shared and hot allocation models, use Locker Allocation Systems UK. For user onboarding, reassignment and offboarding, use Locker Management Systems UK.
Analytics for Schools
School locker analytics may compare demand, damage, access problems and maintenance patterns by year group, block or locker area.
- Demand by year group
- Faults by locker area
- Replacement-key volume by bank
- Damage patterns
- Use before and after timetable or location changes
For the broader education requirement, use School Lockers UK.
Analytics for Healthcare
Healthcare estates can compare staff-locker demand, access reliability and maintenance patterns by department, changing room, shift or site.
- Peak shift-change demand
- Department-level capacity pressure
- Temporary-user volumes
- Repeated lock or door faults
- Differences between comparable changing areas
For staff-changing layouts, uniforms and department workflows, use NHS & Healthcare Changing Room Planning UK.
Analytics for Multi-Site Estates
Portfolio-level analytics is useful when central teams need to compare several sites without losing local context.
- Use common definitions across sites.
- Compare like-for-like populations.
- Declare site-specific exceptions.
- Normalise for estate size where appropriate.
- Separate physical condition from usage.
- Use central trends to identify where local inspection is needed.
Route Analytical Findings to the Correct Owner
| Analytical finding | What the evidence supports | Decision owner |
|---|---|---|
| Persistent high occupancy in one zone | Capacity or distribution deserves review | Occupancy Management / Locker Planning |
| Persistent low measured use | Verify allocation, location, suitability and demand before changing capacity | Locker Management / Occupancy / Planning |
| Repeated faults in one lock family | Technical inspection and maintenance analysis are justified | Predictive Maintenance / CAFM |
| Rising failed access | Event, credential, hardware or system investigation is justified | Access Audit / Access Control |
| Repeated repairs on the same assets | The recurring pattern is lifecycle evidence | Lifecycle Management |
| Approved replacement programme shows rising cost exposure | Financial forecast should be updated | Capital Planning |
| Large site-to-site difference | Definitions, denominators and local context need checking | Analytics first; then the relevant specialist owner |
| Baseline worsens after an intervention | The intervention outcome deserves investigation | The owner of the intervention plus Estate Management |
Analytics owns the comparison and the interpretation. It should identify why further investigation is justified and where the evidence should go next, without presenting the downstream decision as if the dashboard had made it.
Common Smart Locker Analytics Mistakes
- Treating allocation as occupancy. Assigned does not mean used.
- Comparing sites with different definitions. Standardise measures first.
- Using raw counts where estate sizes differ. Use declared denominators.
- Ignoring unavailable lockers. Physical capacity is not always usable capacity.
- Assuming correlation proves cause. Verify the physical and operational context.
- Using averages without peaks. Peak demand often determines operational pressure.
- Hiding missing data. State coverage and limitations.
- Using access failures as a behavioural conclusion. Several technical causes may exist.
- Calling trend analysis predictive maintenance. Prediction and maintenance action need their own evidence model.
- Letting dashboards define the metric. Define the metric before configuring the visualisation.
- Collecting data without a management use. Every report should support a defined question.
- Turning an exception into an automatic action. Route the evidence to the specialist owner.
- Letting analytics choose access technology. Technology selection belongs in Access Control.
- Letting trend data decide repair, refurbishment or replacement. That belongs in Lifecycle Management.
- Treating a forecast as approved capital need. Financial exposure belongs in Capital Planning.
Smart Locker Analytics Checklist
- What question is the analysis trying to answer?
- Which source systems provide the data?
- Are locker and location IDs reliable?
- Are metric definitions documented?
- Is the reporting period appropriate?
- Are sites genuinely comparable?
- Are unavailable lockers excluded where necessary?
- Are missing records visible?
- Is the denominator declared?
- Is there a baseline before major changes?
- Are peak and average demand both understood?
- Can correlation be separated from cause?
- Is personal data minimised where detailed user data is unnecessary?
- Does every analysis have a defined management question?
- Is the downstream decision owner identified?
- Is analytical coverage or confidence visible?
- Is the specialist owner clear when further action is required?
Where Smart Locker Analytics Questions Go Next
| Question | Next guide |
|---|---|
| How is occupancy actually defined and measured? | Locker Occupancy Management Systems UK |
| Which access events should be recorded? | Locker Access Audit Systems UK |
| How should repeated faults support maintenance planning? | Locker Predictive Maintenance UK |
| How are dashboards, exports and APIs implemented? | Smart Locker Management Software UK |
| How should locker systems connect to wider platforms? | Locker Infrastructure Systems UK |
| How should personal data and retention be handled? | Locker Access Compliance UK |
| Where are stable physical asset fields and identifiers maintained? | Locker Asset Register UK |
| Where is the combined estate status maintained? | Locker Estate Management UK |
| When should an asset be repaired, refurbished or replaced? | Locker Lifecycle Management UK |
| How should a replacement programme be phased? | Locker Replacement Planning UK |
| Should the organisation change from assigned to shared use? | Locker Allocation Systems UK |
| How are users onboarded, reassigned or offboarded? | Locker Management Systems UK |
| Which key, PIN, RFID or digital access technology should be used? | Locker Access Control Systems UK |
| How should capital exposure and budget timing be forecast? | Locker Capital Planning UK |
| How should metric definitions and denominators be standardised? | Locker KPI & Performance Metrics UK |
Smart Locker Analytics UK FAQs
What is smart locker analytics?
Smart locker analytics is the structured comparison and interpretation of locker data over time, location or user groups to identify trends, differences, exceptions and evidence for further management action.
What is the difference between locker occupancy and locker analytics?
Occupancy defines and measures whether lockers are being used. Analytics compares those occupancy measures across time, locations or groups and may combine them with other datasets such as faults or access events.
What is a locker occupancy heatmap?
A locker occupancy heatmap visualises a defined occupancy or utilisation measure across locations or time periods. It should clearly state whether it represents allocation, measured use or another metric.
Can locker analytics predict equipment failure?
Analytics can identify repeated faults, access failures, low-battery alerts or high-use components that deserve investigation, but those patterns do not prove that a component will fail at a particular time.
Why are baselines important in locker analytics?
A baseline records performance before a change, allowing the organisation to compare what happened afterwards rather than relying on impressions or unrelated periods.
How should multi-site locker data be compared?
Sites should use consistent metric definitions, comparable reporting periods and declared denominators. Differences in locker quantity, user population, environment and operating model should also be acknowledged.
Does a high fault rate prove a locker product is unsuitable?
No. A high fault rate is evidence for investigation. Usage level, environment, age, maintenance practice, reporting quality and incorrect components may also affect the result.
Should smart locker analytics collect every available data point?
No. Analytics is most useful when each measure has a clear definition, reliable source and management purpose. Collecting additional data without a defined use can add complexity without improving decisions.
Should locker analytics automatically trigger repair, replacement or capacity changes?
No. Analytics can identify persistent patterns, exceptions and evidence that justify further investigation. The relevant specialist process should make the capacity, maintenance, access, lifecycle or capital decision.
Summary
Smart locker analytics should remain focused on interpretation: trends, heatmaps, baselines, comparisons, normalisation, exceptions and data quality.
Keep metric definitions with KPI & Performance Metrics, occupancy definitions with Occupancy Management, event design with Access Audit, predictive maintenance with Predictive Maintenance, software functionality with Smart Locker Management Software, personal-data handling with Compliance, access technology with Access Control, intervention decisions with Lifecycle Management and capital exposure with Capital Planning.
Use analytics to identify where further investigation is justified, quantify the pattern and preserve uncertainty. Do not use a dashboard to turn analytical evidence into an automatic capacity, maintenance, access, lifecycle or funding decision.
Discover more from Blog Total Locker Service
Subscribe to get the latest posts sent to your email.