Locker KPI and Performance Metrics UK
May 14, 2026
Locker KPI and performance metrics help organisations measure how effectively their locker estate is operating. They turn lockers from passive storage into measurable operational assets.
For workplaces, NHS estates, schools, universities, councils, leisure facilities and enterprise organisations, locker performance is no longer only about whether lockers exist. The real question is whether the estate is efficient, reliable, well utilised and financially sustainable.
Performance metrics provide the evidence needed for maintenance planning, occupancy optimisation, replacement forecasting, allocation control and operational decision-making.
What Are Locker KPIs?
Locker KPIs are measurable indicators used to monitor the performance, efficiency and condition of a locker estate.
They allow facilities managers and estates teams to track operational performance over time and compare performance between sites, departments or locker systems.
Locker KPIs may relate to occupancy, maintenance, access control, lifecycle performance, allocation efficiency, operational cost or user demand.
Why Locker Performance Metrics Matter
Without metrics, locker estates are managed reactively. Problems are only noticed when users complain, locks fail or space runs out.
Performance reporting changes this. It allows organisations to identify trends before they become operational problems.
This is especially important in:
- hybrid workplaces
- NHS changing areas
- education environments
- multi-site organisations
- high-turnover workplaces
- public-sector estates
- leisure facilities
- industrial operations
Core Locker Performance Metrics
| KPI | What it measures | Operational value |
|---|---|---|
| Occupancy rate | Percentage of lockers currently in use | Measures demand |
| Utilisation percentage | How effectively lockers are being used over time | Supports allocation planning |
| Turnaround time | Time taken to return a locker to service | Measures operational efficiency |
| Locker downtime | Time lockers remain unavailable | Shows service disruption |
| Lock failure frequency | How often locks fail or require intervention | Measures reliability |
| Maintenance response time | How quickly faults are addressed | Measures support performance |
| Replacement forecasting | Expected replacement timing and investment need | Supports capital planning |
| Allocation efficiency | How effectively lockers are assigned | Improves utilisation |
| Cost-per-user | Operational cost divided by active users | Measures financial efficiency |
Occupancy Rates
Occupancy rate measures how many lockers are actively occupied at a given time. It is one of the most important locker KPIs because it shows whether the estate matches real demand.
Low occupancy may indicate over-supply, poor location, inactive allocations or changing workplace patterns. High occupancy may indicate pressure on capacity, insufficient lockers or operational bottlenecks.
Occupancy rates become even more valuable when tracked across time, departments or sites.
Utilisation Percentage
Utilisation percentage measures how effectively lockers are used over a defined period rather than at a single moment.
This is particularly important for hybrid workplaces and shared-use systems where lockers may rotate between users throughout the day or week.
Utilisation analytics can identify:
- underused locker banks
- peak demand periods
- high-pressure zones
- inactive assigned lockers
- opportunities for shared-use conversion
- estate rationalisation opportunities
Turnaround Time
Turnaround time measures how quickly a locker can return to service after a user change, maintenance event or operational issue.
In high-turnover environments such as gyms, leisure centres, healthcare sites and flexible workplaces, slow turnaround reduces effective capacity.
Good turnaround performance depends on:
- clear allocation workflows
- fast maintenance response
- effective cleaning procedures
- simple access reset processes
- good reporting systems
Locker Downtime
Locker downtime measures how long lockers remain unavailable due to faults, maintenance, damage or operational restrictions.
High downtime reduces user confidence and lowers effective estate capacity. It may also indicate poor maintenance planning or ageing infrastructure.
Downtime reporting should identify:
- average downtime duration
- repeat downtime by locker bank
- environment-related failures
- downtime caused by access systems
- repair backlog trends
Lock Failure Frequency
Lock failure frequency tracks how often locks require repair, reset, override or replacement.
This is one of the strongest indicators of locker estate health because lock problems directly affect user access and operational continuity.
Failure reporting may identify:
- weak lock models
- high-risk environments
- user misuse patterns
- wear caused by heavy occupancy
- aging access systems
- areas needing upgrade or replacement
Maintenance Response Times
Maintenance response time measures how quickly faults are acknowledged, inspected and resolved.
This KPI is important because a locker estate may appear acceptable on paper while users experience long delays in practice.
Response metrics may include:
- average response time
- average repair completion time
- urgent response performance
- repeat maintenance rates
- planned vs reactive maintenance ratio
Replacement Forecasting
Replacement forecasting predicts when lockers, locks or access systems are likely to require replacement.
Forecasting combines:
- lifecycle age
- repair frequency
- maintenance cost trends
- occupancy pressure
- environmental conditions
- condition scoring
- user demand
This allows organisations to spread capital investment over time rather than reacting to sudden failure.
Allocation Efficiency
Allocation efficiency measures how effectively lockers are distributed across users, departments or locations.
Poor allocation often creates hidden waste. Lockers may appear fully allocated while large numbers remain unused in practice.
Allocation analytics can identify:
- inactive assigned lockers
- abandoned allocations
- over-allocation in low-demand areas
- capacity shortages in high-demand zones
- shared-use conversion opportunities
Cost-Per-User Metrics
Cost-per-user metrics measure the operational cost of the locker estate relative to active users.
This helps organisations understand whether the estate is financially efficient.
Cost calculations may include:
- maintenance costs
- replacement costs
- cleaning costs
- lock replacement
- administration time
- software or smart system costs
- energy use for charging lockers
Cost-per-user analysis is especially useful for hybrid workplaces where occupancy patterns may change significantly over time.
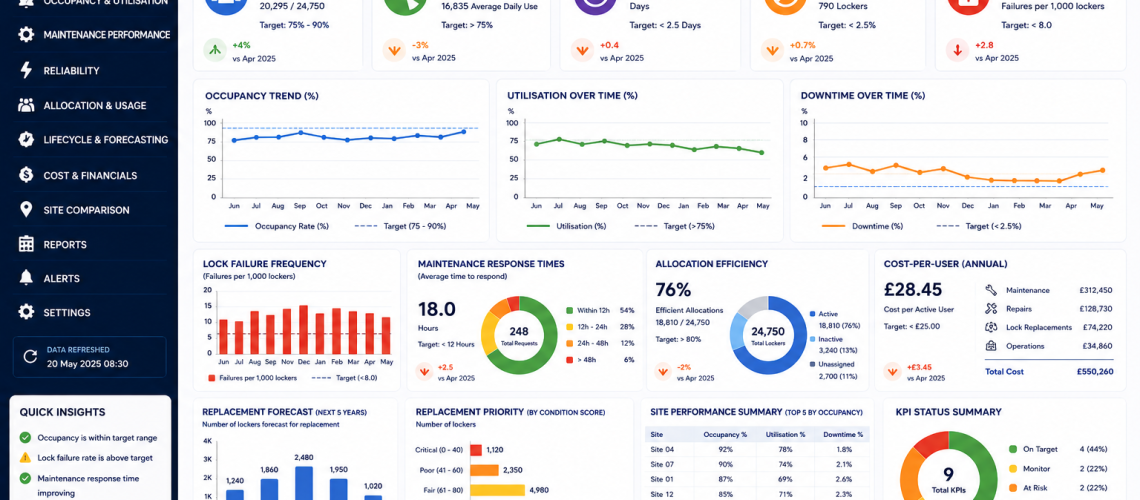
Locker KPI Dashboards
A locker KPI dashboard combines performance metrics into a single reporting system. Dashboards allow facilities teams to monitor operational performance in real time or through scheduled reporting.
Typical dashboard sections include:
- occupancy trends
- utilisation heatmaps
- maintenance status
- downtime reporting
- replacement priority scoring
- site comparison
- compliance indicators
- financial forecasting
Operational Analytics for Multi-Site Estates
Multi-site organisations benefit strongly from locker performance analytics because comparison becomes possible across departments, buildings and regions.
Analytics can show:
- which sites have the highest occupancy pressure
- which sites suffer the most downtime
- where maintenance costs are rising fastest
- which locker types perform best
- where replacement should be prioritised
- which locations are underutilised
This creates a stronger evidence base for procurement and estate planning.
Locker KPIs and FM Intelligence
Locker KPIs are now part of wider FM intelligence systems. They connect with:
- CAFM systems
- asset registers
- occupancy management platforms
- workplace analytics
- lifecycle management
- maintenance planning
- capital forecasting
- governance reporting
This moves locker estates away from simple storage hardware and into measurable operational infrastructure.
Example Locker KPI Reporting Matrix
| KPI | Current value | Target | Status |
|---|---|---|---|
| Occupancy rate | 82% | 75% to 90% | Healthy |
| Utilisation efficiency | 68% | Above 75% | Review allocation |
| Average downtime | 3.2 days | Below 2 days | Needs improvement |
| Lock failure frequency | 14 per month | Below 8 per month | High |
| Maintenance response time | 18 hours | Below 12 hours | Monitor |
| Cost-per-user | £28 annually | Below £25 | Review efficiency |
Internal Links for This Page
- Locker Estate Reporting and Decision Systems UK
- Locker Estate Decision Framework UK
- Locker Estate Governance UK
- Locker Occupancy Management Systems UK
- Locker Predictive Maintenance UK
- Locker Lifecycle Management UK
- Locker CAFM Integration UK
Summary
Locker KPI and performance metrics provide the operational analytics needed to manage locker estates effectively. They measure occupancy, utilisation, downtime, maintenance performance, replacement need and financial efficiency.
For organisations managing complex or multi-site locker estates, performance metrics support smarter planning, better investment decisions and stronger FM intelligence.
This is no longer just locker management. It is operational analytics for the workplace estate.
Discover more from Blog Total Locker Service
Subscribe to get the latest posts sent to your email.